rooftop solar subsidy and payback period , is solar worth it ?
Have you ever opened your monthly utility app, stared at the final bill amount, and felt a cold flash of frustration as the numbers climbed higher than the month before? You are far from alone. Across urban and suburban neighborhoods alike, homeowners are watching electricity bills expand like an unstoppable balloon. For over a decade, rooftop solar was largely viewed as an expensive, futuristic luxury—a niche addition reserved for tech enthusiasts or deeply committed environmentalists who didn’t mind waiting 7 to 10 long years just to break even.
However, the modern financial reality of residential energy has completely flipped upside down. What used to be a slow, sluggish recovery of your initial capital has now transformed into a rapid 3-to-4-year payback reality. Driven by game-changing government financial intervention—most notably the PM Surya Ghar Muft Bijli Yojana, which deposits heavy direct cash subsidies straight into bank accounts—and compounded by relentless, escalating local grid tariffs, the financial math behind home solar has become unassailable.
Today, installing solar panels on your roof is no longer just a green lifestyle choice; it is one of the most lucrative, low-risk, and aggressive financial defense mechanisms available to modern homeowners. In this comprehensive, long-form guide, we will break down the exact economic shift, dissect real customer savings, walk through the step-by-step numbers for the popular 3 kW system, examine long-term wealth protection, and provide an all-inclusive SEO package to help this analysis dominate online searches.
The Shifting Landscape: Why Solar Paybacks Shrank from 8 Years to 3 Years
To understand how we arrived at today’s dramatic financial tipping point, it is necessary to step back and look at the historical economics of home energy generation. Just five years ago, a homeowner considering a standard 3 kW or 5 kW rooftop solar array faced high hardware prices, limited local manufacturing, complex bureaucratic paperwork, and uncertain utility grid policies.
Back then, the total out-of-pocket setup cost sat heavily on the customer’s shoulders. Without direct upfront financial assistance, a basic residential installation could take anywhere from 7 to 9 years to pay for itself through energy bill offsets. For most families managing household budgets, locking up substantial capital for nearly a decade was a tough sell.
A. Direct Central Government Financial Support
The introduction and aggressive rollout of the PM Surya Ghar Muft Bijli Yojana fundamentally altered the initial capital equation. Unlike older policies that relied on indirect tax credits or slow reimbursement channels, this flagship program provides direct, upfront financial support through Direct Benefit Transfers (DBT).
Up to 2 kW Systems: ₹30,000 per kW in direct cash subsidies.
3 kW Systems: An additional ₹18,000 for the third kilowatt, capping out at a massive ₹78,000 direct subsidy.
State-Level Top-Ups: States like Delhi, Uttar Pradesh, and Gujarat offer additional state-level incentives that can drive net installation outlays even lower.
When the government covers 40% to 50% of your total hardware setup upfront, your starting barrier drops in half before your panels generate a single watt of power.
B. Relentless Hikes in Local Grid Tariffs
While setup costs have been artificially slashed through government intervention, grid-supplied electricity prices have moved aggressively in the opposite direction. State distribution companies (DISCOMs) face escalating operational costs, coal transport expenses, and massive infrastructure modernization debts.
As a result, retail electricity tariffs across major residential slabs have risen at an average rate of 8% to 12% annually. Every time your local utility provider increases its price per unit, the self-generated solar energy produced on your roof becomes immediately more valuable. A kilowatt-hour (kWh) that saved you ₹6 yesterday saves you ₹7 today and ₹8 tomorrow.
By combining heavily discounted capital entry with steadily compounding energy savings, the payback horizon shrank from a long 8 years down to a lightning-fast 3 to 4 years.
The Customer Perspective: Monthly Bills Dropping by 70% to 90%
What does this economic shift look like inside an actual household? For most families, monthly utility expenditures represent a fixed, unyielding drain on income. Running heavy electrical appliances—air conditioners during summer heatwaves, water heaters in winter, refrigerators, induction cooktops, and modern washing machines—pushes middle-class households into the highest, most expensive electricity tariff slabs.
When a properly sized rooftop solar system goes live, the immediate operational impact is dramatic.
The Power of Net Metering
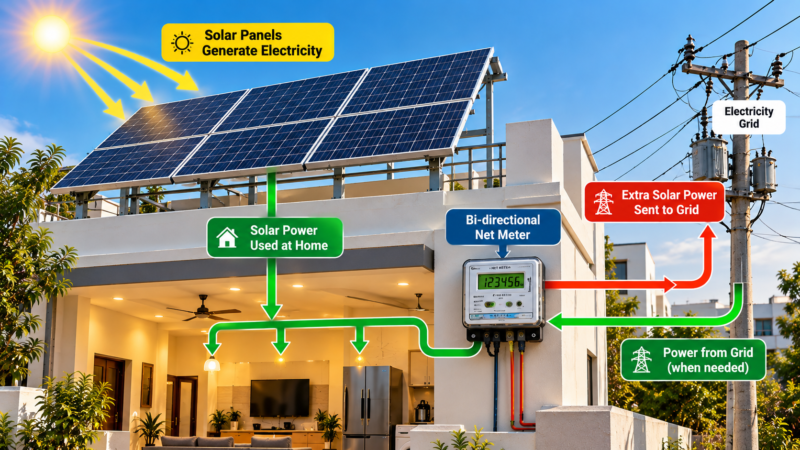
Modern rooftop setups run on bi-directional net metering in solar system . During peak daylight hours, your solar modules generate clean DC electricity, which an inverter converts into AC power to run your household appliances directly.
If your solar system array generates more electricity than your home consumes during sunny afternoon hours, the surplus power flows backward into the public distribution grid. Your net meter records these exported units as financial credits. During nighttime hours—when your panels are idle—your home seamlessly pulls power back from the grid, utilizing your accumulated day credits to offset the cost.
Eliminating the High Tariff Slabs
Most utility providers employ progressive slab pricing: the more units you consume in a billing cycle, the higher the rate per unit becomes. For instance, initial units might cost ₹4 per unit, but once your usage crosses 300 or 500 units, every additional unit is billed at ₹8 to ₹10.
Solar generation acts as a shield against these upper-tier penalties:
-
Slab Displacement: Solar energy fulfills your baseline daily consumption, keeping your net grid draw inside the lowest, cheapest tariff bracket.
-
Predictable Budgeting: Instead of fearing seasonal spikes in power consumption, monthly energy expenses stabilize near basic fixed grid maintenance fees.
-
Behavioral Relief: Homeowners report feeling comfortable running climate control appliances without experiencing constant anxiety over the impending end-of-month bill with solar system
Financial Deep-Dive: Crunching the Numbers on the "ROI King" 3 kW System
To understand why solar energy provides a financial return that rivals or beats traditional stock market index funds, real estate rentals, and fixed deposits, let’s look at a detailed financial model for a standard 3 kW residential system.
A 3 kW array is widely recognized as the “sweet spot” for 2BHK and 3BHK urban residences because it fully optimizes the maximum central subsidy cap available under current schemes.
The Payback Math in Action
Using simple payback calculations of solar system without factoring in compounding tariff increases:
Even when factoring in realistic operational variables—such as cloudy monsoon days, minor panel dust accumulation, or regional grid connection fees—the payback timeline remains securely within 2.5 to 3.5 years.
| Financial Metric | Traditional Fixed Deposit (FD) | Equity Mutual Funds | Rooftop Solar (3 kW) |
| Initial Investment | ₹82,000 | ₹82,000 | ₹82,000 (Net) |
| Annual Return Rate | ~6.5% to 7.5% | ~12% to 15% | ~35% to 42% (in avoided costs) |
| Payback Window | ~10 Years | ~5 to 6 Years | 2.5 to 3.5 Years |
| Tax Impact | Fully Taxable Income | Capital Gains Tax Applies | 100% Tax-Free Savings |
| Inflation Resilience | Negative (Eroded by inflation) | High | Extremely High (Tariff |
Step-by-Step Execution: From Online Application to Active Generation
Despite the compelling financial rewards, many homeowners delay going solar because they assume the installation and approval process is bogged down by red tape. However, modern digital frameworks have streamlined the entire customer journey into a clear, trackable pipeline of solar system
Step 1: Portal Registration & Document Upload
Homeowners begin by logging into the official national rooftop solar portal (pmsuryaghar.gov.in). You select your local DISCOM, enter your electricity consumer account number, and submit basic identification details alongside a recent electricity bill copy.
Step 2: Technical Feasibility Approval
Once submitted, your local DISCOM performs an online technical feasibility assessment. Engineers check whether the local transformer and grid infrastructure in your neighborhood can accommodate additional solar power input. Feasibility approval is typically granted within 7 to 14 business days.
Step 3: Certified Installation via Impaneled Vendor
Upon receiving feasibility approval, you select an impaneled vendor from the portal’s approved directory. Using impaneled installers ensures that your solar panels comply with national manufacturing standards (such as Approved List of Models and Manufacturers certification) and qualify for government subsidy transfers for rooftop solar system.
Step 4: Net Meter Installation and Inspection
After physical installation on your rooftop, the vendor submits a plant completion report. DISCOM officials conduct a brief site inspection to verify safety compliance, install the bi-directional net meter, and issue a formal System Commissioning Certificate.
Step 5: Direct Subsidy Cash Disbursement
Once the commissioning certificate is uploaded to the portal, you submit your bank account details and a canceled check. The central subsidy amount (up to ₹78,000) is transferred directly into your bank account via Direct Benefit Transfer (DBT), completing the cycle
Wealth Protection: The 25-Year Operational Dividend
The financial journey does not end when your solar system achieves full capital recovery in Year 3 or 4. In fact, that is precisely when the true wealth-generation phase begins.
Modern tier-1 monocrystalline PERC and N-type TOPCon solar system modules come standard with 25-to-30-year linear performance warranties. Manufacturers guarantee that after 25 years of continuous operation, panels will still deliver at least 80% to 85% of their original nameplate power capacity.
Cumulative 25-Year Return Profile
Consider the long-term wealth protection generated by a net ₹82,000 outlay:
-
Initial Investment Recovery: Completed by Year 3.5.
-
10-Year Cumulative Savings: Over ₹3,800,000 (factoring in a modest 6% annual grid tariff inflation rate).
-
25-Year Cumulative Savings: Exceeds ₹8,500,000 to ₹10,000,000 in total avoided electricity expenses over the operational lifespan of the installation.
Property Value Enhancement
In addition to direct utility bill reductions, properties equipped with functional, net-metered rooftop solar systems command premium valuations in residential real estate markets. Homebuyers increasingly recognize that a solar-equipped property comes with built-in, perpetually reduced monthly operating overhead, making the home significantly more attractive to prospective solar system buyers or tenants.
Real-World Case Studies: How Urban Households Scaled Their Returns
To illustrate how these dynamics work across diverse residential setups, let’s examine three real-world household scenarios.
Case Study A: The Suburban Nuclear Family (Delhi NCR)
Property: 3BHK Independent Floor
Monthly Power Consumption: ~400 Units (High summer AC usage)
Pre-Solar Average Monthly Bill: ₹3,800
System Installed: 3 kW On-Grid Solar Array
Gross Setup Cost: ₹1,55,000
Subsidies Claimed: ₹78,000 (Central) + ₹30,000 (State Top-Up) = ₹1,08,000 Total Benefit
Net Investment: ₹47,000
Post-Solar Average Monthly Bill: ₹350 (Basic fixed grid charge)
Annual Savings: ₹41,400
Actual Payback Period: 1.13 Years (13.5 Months)
Case Study B: The Multi-Generational Home (Bengaluru)
Property: 4BHK Villa
Monthly Power Consumption: ~750 Units
Pre-Solar Average Monthly Bill: ₹6,200
System Installed: 5 kW On-Grid Solar Array
Gross Setup Cost: ₹2,40,000
Subsidies Claimed: ₹78,000 (Capped Central Assistance)
Net Investment: ₹1,62,000
Post-Solar Average Monthly Bill: ₹850
Annual Savings: ₹64,200
Actual Payback Period: 2.52 Years
Case Study C: The Retired Couple (Jaipur)
Property: 2BHK Bungalow
Monthly Power Consumption: ~220 Units
Pre-Solar Average Monthly Bill: ₹1,900
System Installed: 2 kW On-Grid Solar Array
Gross Setup Cost: ₹1,10,000
Subsidies Claimed: ₹60,000 (Central DBT)
Net Investment: ₹50,000
Post-Solar Average Monthly Bill: ₹180
Annual Savings: ₹20,640
Actual Payback Period: 2.42 Years
Strategic Checklist: How to Maximize Your Solar ROI

If you are ready to take advantage of current subsidy frameworks for solar system and rising tariff rates, use this strategic implementation checklist to ensure your installation yields maximum returns:
[ ] 1. AUDIT YOUR UTILITY BILLS
    Review 12 months of electricity statements to determine average monthly unit (kWh) consumption.

[ ] 2. MEASURE SHADE-FREE ROOFTOP AREA
    Ensure you have approximately 80 to 100 sq. ft. of unshaded rooftop space per 1 kW of planned solar capacity.

[ ] 3. OPTIMIZE SYSTEM SIZING FOR SUBSIDY CAPS
    Select a 3 kW capacity to capture the maximum ₹78,000 central subsidy rebate.

[ ] 4. VERIFY ALMM & DCR COMPLIANCE
    Confirm that your vendor uses Domestic Content Requirement (DCR) solar modules listed on the ALMM register.

[ ] 5. INSIST ON BI-DIRECTIONAL NET METERING
    Ensure your local DISCOM installs a net meter to log surplus energy exports.

[ ] 6. ESTABLISH A ROUTINE MAINTENANCE SCHEDULE
    Clean solar panels with water once or twice a month to clear dust
Final Verdict: Is Solar Finally Worth It?
The long-standing skepticism surrounding residential solar panel installations is officially obsolete. When you evaluate the convergence of direct government subsidy transfers under the PM Surya Ghar scheme, compound growth in municipal grid tariffs, and streamlined digital application portals, the conclusion is clear for solar system .
A solar panel setup is no longer an expensive environmental luxury for solar system that takes a decade to break even. It is an aggressive, inflation-hedged financial instrument that returns your capital in 3 to 4 years and continues to pay substantial cash dividends solar system for another two decades. If you own your roof and pay a monthly power bill, there has never been a more opportune moment to convert passive overhead into long-term financial security.
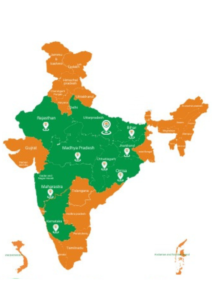
Trusted by 50000+ Customers
Anya Green Energy is a leading solar company and Solar Energy service provider established in 2013. We are recognized by startup India and customer best choice award 2022.
Our Achievements :
Recognized by Startup India.
Purvanchal’s first solar company to operate exclusively with solar products.
Certified by well-known institutions such as MSME, IndiaMart, and Just Dial and many more.
Winner of the Best Customer Choice Award 2022.
Over 50,000 happy customers across India.