
Green Hydrogen Cost Curve: When Will It Actually Compete With Fossil Fuels?
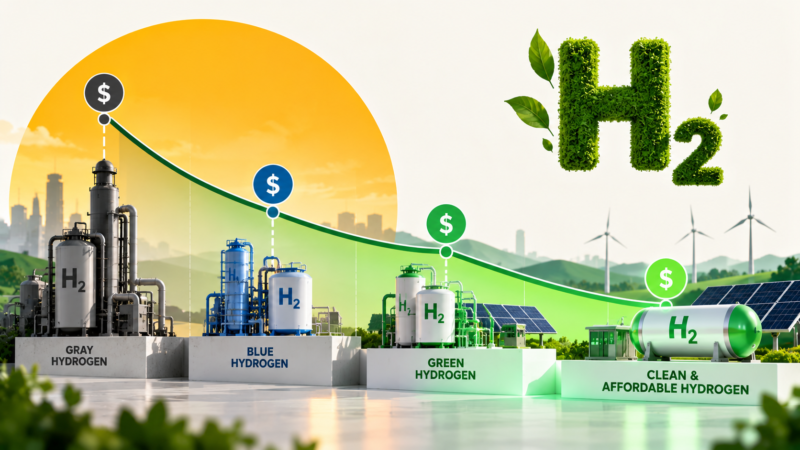
Every major clean energy transition has a defining question: not whether the technology works, but when it becomes cheap enough to win on economics alone. For hydrogen, that question is answered by tracking the green hydrogen cost curve — the trajectory showing how production costs are falling over time, and how close green hydrogen is getting to competing directly with fossil-fuel-based alternatives.
This blog breaks down what’s actually driving the green hydrogen cost curve downward, current realistic figures for green hydrogen production cost, how that compares honestly against the cost of green hydrogen vs grey hydrogen, the role of electrolyzer cost reduction in bending the curve, and realistic expectations for reaching green hydrogen price parity in the years ahead.
What Is the Green Hydrogen Cost Curve?
The green hydrogen cost curve refers to the projected trajectory of production costs for hydrogen made via electrolysis powered by renewable electricity, typically measured in cost per kilogram of hydrogen produced. Unlike a single cost estimate, a cost curve captures the trend over time — showing how falling renewable electricity prices, improving electrolyzer efficiency, and manufacturing scale are expected to bring green hydrogen production cost down year after year.
Understanding the green hydrogen cost curve matters because it directly determines adoption timelines. Industries considering a shift to green hydrogen for steel production, shipping fuel, or chemical feedstock need to know not just that costs are falling, but roughly when they’ll fall enough to justify the switch from existing fossil-based processes.
Green Hydrogen Production Cost: The Three Core Drivers
Green hydrogen production cost is shaped by three primary inputs: the cost of renewable electricity used in electrolysis, the capital cost of the electrolyzer itself, and the efficiency of the conversion process from electricity to hydrogen.
Renewable electricity costs have fallen dramatically over the past decade, and continued declines in solar and wind generation costs directly flow through to lower green hydrogen production cost, since electricity typically represents the largest single input cost in the entire production process. Electrolyzer capital costs form the second major driver, while conversion efficiency — how much hydrogen is produced per unit of electricity input — determines how effectively that electricity translates into usable fuel.
Together, these three factors explain why the green hydrogen cost curve has been bending downward consistently, even as absolute costs remain higher than fossil-based alternatives today.
Cost of Green Hydrogen vs Grey Hydrogen: The Honest Comparison
To understand why the green hydrogen cost curve matters so much, it helps to look at the cost of green hydrogen vs grey hydrogen directly. Grey hydrogen — produced from natural gas through steam methane reforming — remains the cheapest and most widely used form of hydrogen production today, benefiting from decades of established infrastructure and relatively low natural gas input costs in many regions.
Green hydrogen, by contrast, currently costs more per kilogram to produce in most markets, primarily due to higher electrolyzer capital costs and the premium associated with dedicated renewable electricity supply. However, the cost of green hydrogen vs grey hydrogen gap has been narrowing steadily, and in regions with exceptionally cheap renewable electricity — strong solar resources combined with falling panel and electrolyzer costs — the gap is closing faster than in regions dependent on grid electricity or less favorable renewable conditions.
| Factor | Grey Hydrogen | Green Hydrogen |
|---|---|---|
| Primary Input | Natural gas | Renewable electricity |
| Current Relative Cost | Lower | Higher (but falling) |
| Emissions | High (fossil-based) | Near-zero |
| Cost Trend | Tied to gas price volatility | Steadily declining |
| Infrastructure Maturity | Highly mature | Rapidly scaling |
This comparison is central to the green hydrogen cost curve conversation because grey hydrogen isn’t a fixed target — it moves with natural gas prices, while green hydrogen costs move predictably downward as technology and scale improve, which is exactly why analysts expect the lines to eventually cross.
Ready to switch to Solar?
Solar solutions with Anya Green Energy and discover how you can reduce your electricity bills.
Contact UsElectrolyzer Cost Reduction: The Engine Behind the Curve
Perhaps no single factor matters more to bending the green hydrogen cost curve than electrolyzer cost reduction. Electrolyzers — the devices that split water into hydrogen and oxygen using electricity — have historically been produced at relatively small manufacturing scale, keeping unit costs high.
As manufacturing scales up globally, following a cost-reduction pattern similar to what solar panels and lithium-ion batteries experienced in their own growth phases, electrolyzer cost reduction is expected to accelerate meaningfully. Larger manufacturing facilities, standardized designs, and improved materials (reducing reliance on expensive catalysts like platinum and iridium) are all contributing to this trend. Every percentage point of electrolyzer cost reduction translates directly into a steeper decline along the broader green hydrogen cost curve, making this one of the most closely watched metrics by industry analysts and investors alike.
Green Hydrogen Price Parity: When Might It Actually Happen?
Green hydrogen price parity — the point at which green hydrogen costs the same or less than grey hydrogen without subsidy — is the milestone the entire industry is working toward. Illustrative industry projections (to be verified against current IEA/BNEF hydrogen cost reports) suggest that in regions with excellent renewable resources and supportive policy, green hydrogen price parity could be reached for certain applications before the end of this decade, while other regions with less favorable conditions may take longer.
Reaching green hydrogen price parity won’t happen uniformly across the globe or across all use cases simultaneously. Industrial applications with flexible operating schedules that can take advantage of the cheapest renewable electricity hours may reach parity sooner than applications requiring constant, round-the-clock hydrogen supply. This uneven path is an important nuance often missing from headline predictions about the green hydrogen cost curve.
India's Position on the Green Hydrogen Cost Curve
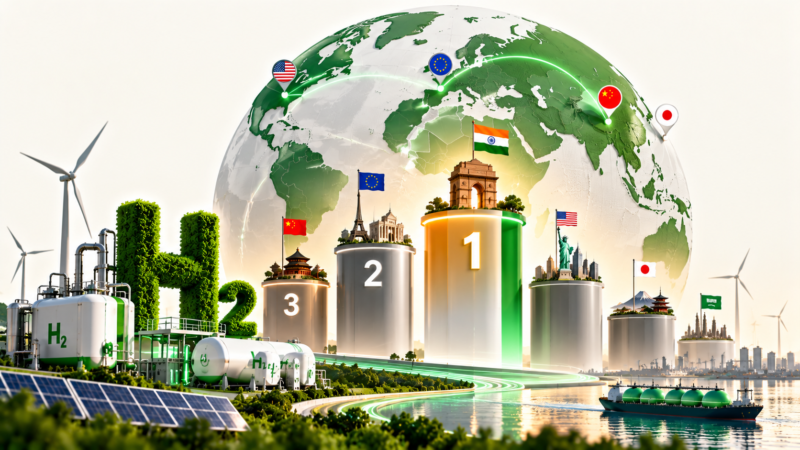
India’s National Green Hydrogen Mission and abundant, low-cost solar resources position the country as a potentially fast-moving point on the global green hydrogen cost curve. With some of the lowest solar electricity costs globally, India has a structural advantage in driving down green hydrogen production cost, provided electrolyzer manufacturing scales domestically as planned under current production-linked incentive schemes.
If India’s electrolyzer cost reduction trajectory follows its solar manufacturing playbook — where domestic scale-up drove costs down faster than many global forecasts anticipated — the country could reach competitive green hydrogen price parity for export-oriented production earlier than some international projections currently suggest, a development worth watching closely for its broader clean energy implications.
What Could Slow Down the Cost Curve?
Not every factor points toward a smooth, predictable decline. Supply chain constraints for critical electrolyzer materials, slower-than-expected renewable electricity buildout in some regions, and policy uncertainty around subsidies and carbon pricing could all flatten the green hydrogen cost curve compared to optimistic projections. Water availability for electrolysis is also a genuine constraint in water-stressed regions, adding a cost and logistics dimension not always captured in headline green hydrogen production cost figures.
Being realistic about these risks matters — overly optimistic projections about the green hydrogen cost curve that fail to account for these frictions can lead to poor investment and policy decisions if the curve bends more slowly than expected.
Expert Perspective
As one energy economist put it in a recent industry analysis, paraphrased here: the green hydrogen cost curve won’t bend in a straight line — it will bend fastest where cheap renewable electricity, supportive policy, and electrolyzer manufacturing scale all converge in the same place, and slowest everywhere else, which means price parity will arrive unevenly across regions and industries rather than as a single global milestone.
Conclusion
The green hydrogen cost curve tells a story of genuine, measurable progress rather than distant speculation. Falling green hydrogen production cost, meaningful electrolyzer cost reduction, and a narrowing gap in the cost of green hydrogen vs grey hydrogen all point toward green hydrogen price parity becoming achievable in specific regions and applications well within this decade. For industries, investors, and policymakers tracking this space, the green hydrogen cost curve remains one of the clearest indicators of how quickly the broader clean energy transition can realistically scale — not based on hope, but on the hard economics of electricity, electrolyzers, and manufacturing at scale.
FAQs
Q1: What is the green hydrogen cost curve?
A: It’s the projected trajectory of green hydrogen production costs over time, showing how falling renewable electricity prices and electrolyzer improvements are expected to reduce costs year after year.
Q2: Why is green hydrogen currently more expensive than grey hydrogen?
A: Green hydrogen relies on electrolyzers and dedicated renewable electricity, both of which currently cost more than the natural gas-based process used for grey hydrogen, though this gap is narrowing.
Q3: What is driving electrolyzer cost reduction?
A: Manufacturing scale-up, standardized designs, and reduced reliance on expensive catalyst materials are the main factors driving electrolyzer cost reduction, similar to cost declines seen in solar and battery manufacturing.
Q4: When will green hydrogen reach price parity with fossil fuels?
A: Timelines vary by region and application — areas with cheap renewable electricity and supportive policy, like parts of India, may reach green hydrogen price parity sooner than regions with less favorable conditions.
Q5: Is India well positioned on the green hydrogen cost curve?
A: Yes — India’s low-cost solar resources and domestic manufacturing incentives give it a structural advantage in driving down green hydrogen production cost faster than some global projections anticipate.

Trusted by 50000+ Customers
Anya Green Energy is a leading solar company and Solar Energy service provider established in 2013. We are recognized by startup India and customer best choice award 2022.
Our Achievements :
Recognized by Startup India.
Purvanchal’s first solar company to operate exclusively with solar products.
Certified by well-known institutions such as MSME, IndiaMart, and Just Dial and many more.
Winner of the Best Customer Choice Award 2022.
Over 50,000 happy customers across India.