
Carbon Credits Explained: The 2026 Guide to Emissions, Country Rankings & Net Zero Goals
In 2025, the planet crossed a grim threshold: global greenhouse gas output hit roughly 38.1 billion tonnes of CO2 from fossil fuels and industry alone, and if you count every gas, the number climbs past 41 billion tonnes. At the same time, something quieter but equally important happened — the market for carbon credits pushed past the billion-dollar mark in actual retirements, with corporate pledges to buy future credits surging over 200% year-on-year.
These two numbers are two sides of the same coin. One measures the problem. The other measures a tool built to fix it. But most people, and honestly most business leaders, still mix up the two, or assume this system just lets big polluters buy their way out of responsibility. That confusion is exactly why this guide exists.
Here, we’ll walk through what the world’s carbon emissions actually look like right now, how carbon trading and the credit-and-offset market function, which countries are winning and losing the climate race, what global goals are driving policy, and where this whole system is headed by 2030. Every angle — environmental, economic, political, and personal — gets covered here, so you leave with a complete picture, not just a definition.
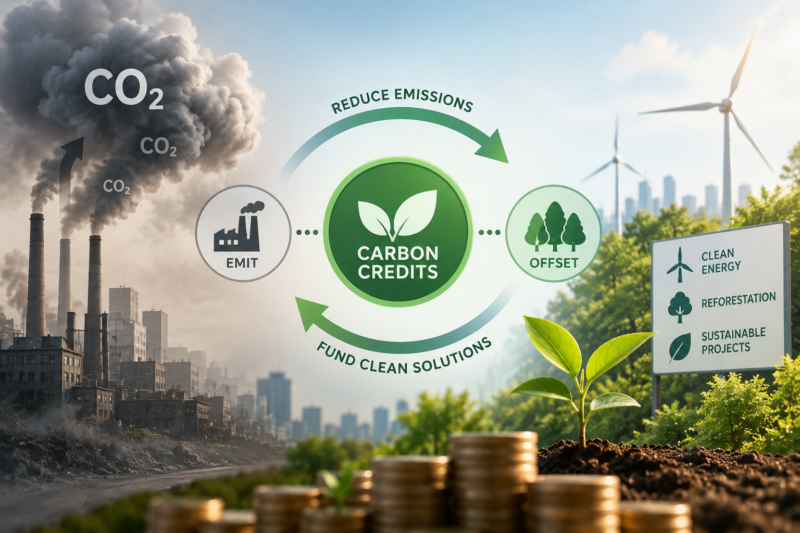
What Are Carbon Emissions? The Current Global Picture
Carbon emissions refer to the release of carbon dioxide and other greenhouse gases into the atmosphere, mainly from burning coal, oil, and natural gas, plus deforestation, cement production, and heavy industry. These gases trap heat, driving global warming and long-term climate change.
Here’s where things stand as of the latest full-year figures:
- Total global CO2 output in 2025 reached approximately 38.1 billion tonnes, a record high, though annual growth slowed to under 1% — the weakest pace of increase in over a decade outside pandemic years.
- Atmospheric CO2 concentration hit around 427 parts per million, roughly 50% above pre-industrial levels.
- Power-sector output actually declined slightly (-0.9%) in 2025, thanks to record solar and wind deployment avoiding more than 10 billion tonnes of CO2 that would otherwise have entered the sky.
- The remaining “budget” for keeping warming under 1.5°C is projected to be exhausted by 2029 at current rates.
What’s striking is the split: clean electricity is genuinely decoupling from economic growth in many regions, but transport, aviation, shipping, and heavy industry are still climbing. This is precisely the gap that offset instruments and organized trading systems were designed to help close, by putting a financial cost on the pollution that can’t yet be eliminated directly.
Carbon Footprint vs. Emissions: What's the Difference?
People often use “carbon footprint” and emissions interchangeably, but there’s a subtle distinction worth knowing. Raw output usually refers to the physical release of greenhouse gases from a single source — a plant, a factory, a country. A carbon footprint is broader: it’s the total impact attributable to a person, product, company, or event across its entire lifecycle, including indirect (Scope 3) sources like supply chains and business travel.
Understanding your carbon footprint is the first step before any organization can credibly claim it’s cutting output or purchasing offsets to cover what remains. Skipping this step is one of the most common reasons corporate climate claims get labeled greenwashing.
What Are Carbon Credits? The Basics
A carbon credit is a certificate representing the reduction, avoidance, or removal of one metric tonne of CO2, or its equivalent in other greenhouse gases. Think of it as proof of climate work: instead of simply permitting pollution, these certificates are generated by projects that actively cut or remove emissions — renewable energy installations, reforestation, methane capture, direct air capture, and efficiency upgrades.
There are two broad systems:
- Compliance markets — Government-regulated schemes like the EU Emissions Trading System (EU ETS), where companies in capped sectors must hold enough allowances to cover their output, or pay a penalty. The EU ETS covers over 11,000 installations and roughly 45% of the EU’s total greenhouse gas footprint.
- Voluntary markets — Where companies or individuals purchase carbon credits on their own initiative, usually to meet corporate sustainability pledges or net zero targets, not because a law requires it.
These certificates are traded much like a commodity. One unit equals one tonne of CO2-equivalent avoided, reduced, or removed, and is typically certified by an independent registry such as Verra, Gold Standard, or the American Carbon Registry to confirm the reduction is real, measurable, and lasting.
How Carbon Trading Actually Works
Carbon trading is the mechanism that turns a paper certificate into a functioning market. Here’s the simplified flow:
- A project developer builds something that reduces greenhouse gas output — say, a wind farm that displaces coal power, or a forest-conservation scheme that prevents deforestation.
- An independent verifier audits the project and confirms the actual tonnes avoided or removed.
- A registry issues units equal to that verified amount.
- Companies or governments buy these units on the open market, either directly from developers or through brokers and exchanges.
- When a buyer uses a unit to offset its own footprint, it is “retired” and can never be resold or reused.
This structure is what allows a factory in Germany to fund a solar project in Kenya and count the reduction toward its own climate target. Whether that’s a fair trade-off is one of the most debated questions in climate policy — more on that below.
Why This Market Matters: Current Data (2026)
The numbers here vary depending on which research firm you ask, and that variance is itself telling — this is still a young, fragmented market. But the direction is consistent across every source:
- The compliance segment, led by the EU ETS, was valued at roughly $886.8 billion in 2025 and is projected to grow toward $1.2 trillion in 2026, driven almost entirely by regulatory expansion.
- The voluntary segment is far smaller but growing faster in percentage terms — estimates range from about $1.6 billion to $5.3 billion in 2025, with compound annual growth forecasts between 20% and 38% through the early 2030s.
- EU compliance allowances traded around €84 per tonne in August 2026, roughly three to four times the price of most nature-based voluntary units.
- Corporate pledges to buy future carbon credits surged over 200% in the past year, even as actual retirements dipped slightly, suggesting buyers are locking in high-quality supply ahead of an expected price rise.
- Asia-Pacific is emerging as a new center of gravity for issuance and demand, alongside the traditionally dominant North American and European buyers.
- Long-term forecasts from BloombergNEF suggest supply of these units could grow 20 to 35 times by 2050 as removal technologies scale and costs fall.
The takeaway for businesses: if you’re planning to lean on these offsets for a 2030 or 2035 net zero target, prices are on a rising long-term trajectory, and the highest-integrity, durable projects already command a premium over cheaper, lower-quality options.
Global Goals Driving the Climate Agenda
No discussion of emissions or offset markets is complete without the policy backdrop. A handful of overlapping goals shape almost every government and corporate decision here:
- The Paris Agreement (2015): The foundational treaty committing nearly 200 countries to keep global warming “well below” 2°C, ideally under 1.5°C, above pre-industrial levels.
- National net zero targets: Most major economies have now pledged some form of climate neutrality — China by 2060, the EU and UK by 2050, India by 2070. Reaching that goal doesn’t mean eliminating every tonne of output; it means residual pollution is balanced out by removals, often financed through carbon credits.
- Article 6 of the Paris Agreement: This framework lets countries trade emissions reductions internationally, effectively creating a government-level trading system that runs alongside corporate voluntary markets.
- COP30 outcomes: Recent summits have pushed for tighter integrity standards on offset projects, aiming to eliminate double-counting and phantom credits that don’t represent real reductions.
- Corporate science-based targets: Thousands of companies have adopted third-party-verified goals that dictate how much they must cut directly versus how much they can address through offsets.
These goals matter because they create the demand side of the market. Without binding or reputational pressure to decarbonize, there would be little reason for a company to spend money shrinking its footprint through offsets rather than simply continuing to pollute.
Country-by-Country Comparison: Who Emits, Who Trades, Who Leads
Greenhouse gas output is not evenly distributed, and neither is participation in offset markets. Here’s how the major players compare on the latest available data:
| Country/Region | Annual CO2 Emissions | Share of Global Total | Per Capita Emissions | Climate Target |
|---|---|---|---|---|
| China | ~12.6 billion tonnes | ~30% | ~8 tonnes | Peak before 2030, carbon neutral by 2060 |
| United States | ~4.5–4.8 billion tonnes | ~11–14% | ~14.9 tonnes (highest among major emitters) | Climate neutral by 2050 (federal target, policy has shifted) |
| India | ~2.8–4.1 billion tonnes | ~7–8% | ~2 tonnes (less than half the global average) | Carbon neutral by 2070 |
| European Union | ~3.2 billion tonnes | ~6% | ~6.2 tonnes | Climate neutral by 2050; runs the world’s largest compliance trading system |
| Russia | ~1.8 billion tonnes | ~5% | ~11.4 tonnes | Carbon neutral by 2060 |
| Japan | ~0.96–1.0 billion tonnes | ~2% | ~8.5 tonnes | Climate neutral by 2050 |
Four Dimensions of the Emissions and Offsets Debate
To really understand this topic, it helps to view it through four distinct lenses.
1. The Environmental Dimension
At its core, this is a physics problem: greenhouse gases trap heat, and cutting output is the only way to slow warming. Offset projects are only environmentally meaningful if they represent genuine “additionality” — meaning the reduction wouldn’t have happened without the funding — and if it’s permanent rather than reversible (a replanted forest that later burns down undoes the benefit).
2. The Economic Dimension
Trading puts a price on pollution, which economists broadly agree is one of the most efficient ways to change behavior at scale. It also creates entirely new industries — verification, registries, brokers, and removal technology — that didn’t exist two decades ago and are now projected to be worth trillions of dollars by the mid-2030s.
3. The Political Dimension
National targets and offset rules are negotiated at the UN level but implemented very differently country by country, creating a patchwork of compliance schemes, voluntary standards, and enforcement gaps. A single political shift, like a country exiting or re-entering a climate agreement, can move markets overnight.
4. The Social and Equity Dimension
Historically, wealthy nations built their economies on cheap fossil fuels and are responsible for the bulk of cumulative pollution. Now, some of the same nations buy carbon credits from developing countries to meet their own targets. Whether that’s a fair transfer of resources or a modern form of outsourcing responsibility is a genuinely open debate, and one worth including in any honest conversation about climate solutions.
What This Means for Businesses and Individuals
If you’re a business leader, the practical playbook looks like this:
- Measure your carbon footprint first. You cannot credibly offset what you haven’t measured.
- Cut direct emissions wherever possible — efficiency, renewable energy procurement, and process changes should always come before purchasing offsets.
- Use offsets for the residual gap, not as a first resort, and prioritize verified, high-integrity projects over the cheapest option available.
- Track policy — as compliance carbon trading systems expand and Article 6 rules mature, what counts as a valid unit is likely to get stricter, not looser.
If you’re an individual, the same logic scales down: reduce flights, energy use, and waste first, and treat any personal purchase of carbon credits as a top-up for what you genuinely can’t eliminate yet, not a license to ignore your footprint entirely.
The Road Ahead: Where This Market Is Headed
Looking toward 2030 and beyond, a few trends are converging:
- Growth is slowing, but not falling fast enough. The gap between “peaking” and “declining” output is where the next decade of climate policy will be fought.
- The market is consolidating around quality. Expect fewer, better-verified projects rather than a flood of cheap, low-integrity units.
- Compliance schemes will likely absorb parts of the voluntary side, as regulators explore letting companies use high-quality voluntary carbon credits toward compliance obligations.
- Removal technology will grow its share. Engineered removal, currently a small fraction of total units issued, is expected to expand rapidly as costs fall.
- Country comparisons will keep shifting. Watch China’s plateau, India’s rising-but-still-low per capita figure, and whichever government next re-engages, or disengages, from international trading frameworks.
Frequently Asked Questions
Is buying an offset the same as reducing pollution? No. Purchasing an offset compensates for pollution elsewhere; it doesn’t shrink the buyer’s own operational output. The most credible corporate strategies cut direct output first and use offsets only for what’s genuinely hard to eliminate right now, such as long-haul aviation or heavy manufacturing.
Who actually sets the price of an offset? Compliance-market prices are set by supply and demand within a government-capped system — the EU’s scheme is the clearest example, since regulators control the total number of allowances issued each year. Voluntary-market prices are set more loosely, through direct negotiation between buyers and project developers, and vary enormously based on project type, location, and verified quality.
Why do some offset projects cost so much more than others? Durability and verification quality drive the price gap. A technology-based removal project, like direct air capture, locks carbon away for centuries and is easy to measure precisely, so it commands a premium. A nature-based project, like a reforestation scheme, is cheaper but carries more risk of reversal from fire, disease, or future land-use change.
Can an individual person buy an offset, or is this only for companies? Individuals can absolutely participate. Several verified registries and retail platforms sell small-volume units to consumers who want to compensate for a flight, an event, or their personal lifestyle. The same quality checks apply: look for third-party certification from a recognized registry before paying for anything.
Which country is closest to hitting its climate target? Progress is uneven and hard to compare directly because targets themselves differ. The European Union has the most mature compliance infrastructure and the longest track record of falling output relative to its economy. China’s growth has structurally slowed thanks to record renewable buildout, even though its total output remains the world’s largest. Smaller, wealthier nations with hydro or nuclear-heavy grids, like Sweden and France, already sit close to their long-term goals.
Will this market get bigger or smaller in the next decade? Nearly every independent forecast points to substantial growth, though estimates of exact size vary widely by research firm. The consistent theme is a shift toward higher-integrity, technology-based removal at the expense of cheaper, lower-quality nature-based projects, alongside tighter government rules on what qualifies as a genuine reduction.
Final Thoughts
Global carbon emissions describe the problem in blunt physical terms: more than 38 billion tonnes of CO2 released in a single year, concentrated heavily in a handful of major economies. Carbon credits are one of the more sophisticated tools built to manage that problem — imperfect, sometimes controversial, but backed by a market now measured in the hundreds of billions of dollars and growing fast.
Neither number tells the whole story alone. Understanding both, and how country goals, market dimensions, and policy shifts connect them, is what separates a surface-level take on climate change from a genuinely informed one. That’s the awareness this guide set out to build.
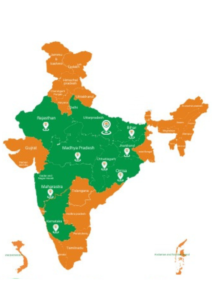
Trusted by 50000+ Customers
Anya Green Energy is a leading solar company and Solar Energy service provider established in 2013. We are recognized by startup India and customer best choice award 2022.
Our Achievements :
Recognized by Startup India.
Purvanchal’s first solar company to operate exclusively with solar products.
Certified by well-known institutions such as MSME, IndiaMart, and Just Dial and many more.
Winner of the Best Customer Choice Award 2022.
Over 50,000 happy customers across India.